Monthly Archives: November 2022

Portfolio Activity #8

https://storymaps.arcgis.com/stories/87eb7c47cb384ba49011d890ec2518c2

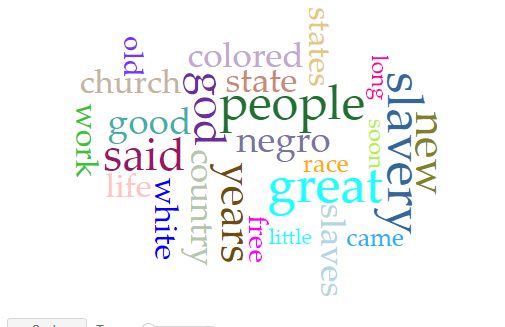
For this assignment I looked at art and illustrations that we worked together to compile on our Omeka site. I took five images that I thought were interesting and depicted various aspects of enslaved life as well as depicting enslaved people in various ways. I wanted to use different artistic images rather than the life of one enslaved person with this intent that I thought it would be more interesting to analyze representations of enslaved people in art during this time period and the stories that they tell at the individual and collective level. 

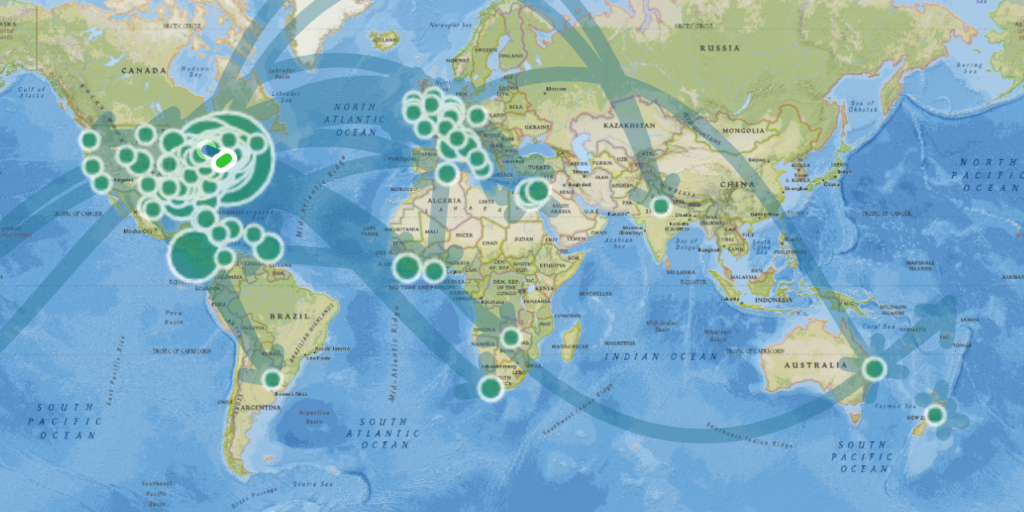
For the assignment I looked at the metadata for locations and searched the internet for some. I then chose locations based on where it was produced, where there were events of significant importance, such as in the instance of the union soldier painting and general location such as depictions of enslaved people in Great Britain and the depiction of enslaved people on a cargo ship. 

Overall, I found that this project went rather well, and that the presentation was rather visually appealing. For the map I chose a tile set that was satellite images, which I find easier to conceptualize. I then chose locations based on what I described above. I chose to not put in descriptions since there appears to be a word count limit and what I would intend to do with this set would just become jumbled if I were to attempt to put descriptions into the small area allowed. I think for future projects where this type of tool would be used might do better as a smaller topic that can then be inserted into a larger project (as I assume is what is commonly used already). 

Portfolio Activity #7

Geospatial visualization can affect historical thinking by being able to ask more questions about geographic distribution through analyzing the placement of various occurrences. Additionally, it can allow for more interactive platforms and visualizations for education on historical topics. This allows us to create projects that are more visually appealing and that promote historical thinking and questions. I think that historical inquiry relates to both concepts of space in different but equally important ways. Since absolute space is more of a theoretical perspective, it relates to historical inquiry through its conceptual ideas. The Representation space of historical inquiry relates more to the physical aspects of history rather than the information. The largest pitfall of the idea of geospatial visualization is the possibility of skewing these visualizations to look like something other than what they are. I have seen this done many times with graphs and data and other visualizations where the data is accurately represented; however, the visualization is changed to convey a different bias to the onlooker who is not necessarily wary of possible influences. When trying to convey information on geographic distribution for different historical purposes, it is possible that projects might wish to adjust visualizations to infer other things for one reason or another. Along the same lines, maps convey information in their own way in a distorted way since they do not show the intricacies of a society where the historical inquiry is taking place. There are also differences in representation based on map style such as google maps versus google earth, these differences will cause analysis to be skewed based on the representations, If viewing a map that is showing major roadways there may be a tendency to base inferences off of these. However, if viewing a map that is showing topography, landforms, and other natural and manmade formations there might be more other inferences made. If there are different inferences made based on view alone this is cause for many concerns since it is changing the thinking of those analyzing the material.  Maps may not always be an accessible tool for people on the user side and the creator side. When making the map, it is possible that there may be fees involved from the use of map tiles depending on what servicer is used. Additionally, since a map is such a large file, there is a strong likelihood that they will be inaccessible to those who have poor internet service. From many historical projects I have looked at and analyzed this has always been an issue, even with rather decent internet service. Since most of the projects using these tools do not anticipate internet traffic of any kind, there is also often an issue of lag or crashing by even a small group looking individually at these visualizations.  

Portfolio Activity #6

https://voyant-tools.org/?corpus=268ebc049399622516f3b5969d5e36bc

Overall, my findings were to be expected when using the data set for Voyant. The most interesting thing that I found was that out of the top four words, three were “man”, “men”, and “mr.”. Mr. was nearly the most prevalent word for the entire data set. I think that this shows how much importance is left to the individual man for the historical context of the time. 

If we are to look at gender roles in these texts, it is very obvious that they are very male centered (whether intentional or not). Of the predetermined most prevalent words there is only mention of enslaved people and men that characterize people and individuals.

 One of the most interesting tools that I used in Voyant was the dreamscapes option. This shows an interactive map, tracking the movement of key words and places. A majority of these bounce back and forth between North America and Africa. While this function is not necessarily the most accurate due to the possibility of different intended meanings of locations, it could still be an important tool when looking at interactions between countries and possible world dynamics.

From my looking around, I also looked at the least  used words in the data set. I think that to an extent these can be useful in looking at specific words and how they might be compared to other words that may be used more frequently; however, there are also numerous words that are only used once and appear to be a pointless inclusion into the data set. Additionally, there is the inclusion of numbers and specific large numbers that do not appear to have any importance on the information trying to be analyzed. I have come across this in other Text analysis using this program because it not only reads the meat of the article but citations, graphics, and footnotes. I have also had trouble before with it including URLs, which is most frustrating.  

Overall, one of the most useful things I found when playing with this dataset is honestly the word cloud. As a person who is a visual learner, this is incredibly helpful in initially conceptualizing what is being presented and if there are adjustments needed to the filters of the program. Along with giving us a very aesthetic graphic to work with, it also provides a quick analysis of what is being presented as a whole for the text analysis of the documents. This is what I would equivalate to an abstract of the analysis of the files provided.  

Portfolio Activity #5

One of the biggest values I see from computational text analysis is to be able to see how language was used in the past, and the present. For historical documents, mining is something that gives us the potential to look at how things were written, how certain topics were written and almost any other question that might relate to the past and how words were used. From an anthropology perspective, this is incredibly important for looking at colloquial language and understanding how geographic regions and cultures use language differently based on context. Additionally, for some anthropologists(including myself) the use of language and frequencies of certain words has become particularly interesting in terms of digital landscapes. One of my particular interests is looking at the buzz words used in online auction platforms to advertise for the sale of illicitly trafficked artifacts and antiquities. This is helpful more to the heritage/museum scope of people to be able to predict how things are trafficked and sold and attempt to prevent further damage to cultural heritage and historical contexts. 

In its most basic nature, data of text mining is useful to be able to look at frequency of words and from there provide visualizations and statistics of the data that is given. It helps us to look at documents in the context of how they were developed and from there give possible historical insights into the nature of the documents. 

One downfall of this method, from my understanding, is that if the texts are not initially digital the programs that analyze texts will not be able to read them. For scanned documents they are simply images that are readable to humans, but not computers. Often for historical documents this is the case; therefore, these texts must have metadata that transcribes all of the text into text readable to a computer. This creates an imperfect system that causes handwritten work to still be present, although not as detailed as it might have been before the time of computational text analysis.